Story
 August 19, 2021
Temperatures in D.C.’s Heat Islands Can Register Ten to Twenty Degrees Hotter Than in Leafy Neighborhoods
Country:


A team of youth reporters will map temperature differences across D.C. and examine the causes and...
“It’s hot. It’s really hot out here,” says Chuck Jackson, a seller of hats who has hawked his wares on the streets of Washington since the early 2000s. Except for a brief hiatus this year after being diagnosed with diabetes, he’s made his living by supplying local shoppers with a wide and colorful selection of broad-brimmed picture hats, bucket hats, baseball caps, and visors.
Within a month of getting out of a nursing home, Jackson returned to street vending in June, just as D.C.’s usual sweaty, sweltering months were getting started. Temperatures crested 90 degrees in D.C. on six days in June and 18 days in July, according to AccuWeather.com. July 22 was one of those 90-plus degree days. Jackson was sitting in one of the hottest spots in all of D.C.—14th Street NW, across the street from the Columbia Heights Metro Station.
Sitting on a collapsible chair in front of his improvised workspace, handcart tucked underneath and golf-size umbrella overhead, Jackson is inside one of Washington’s summertime “heat islands,” where high temperatures can soar as much as 10 or 20 degrees higher than in leafier parts of the District. Not only are tonier neighborhoods such as Barnaby Woods or Chevy Chase comparatively cool during the summer months, wealthier D.C. residents can leave town for the beach or the mountains this time of year. Jackson doesn’t have that option.
As a nonprofit journalism organization, we depend on your support to fund critical stories in local U.S. newsrooms. Donate any amount today to become a Pulitzer Center Champion and receive exclusive benefits!

“I gotta survive,” he says. “It’s my job. I’ve been doing this all my life.”
For Washington’s most vulnerable, the summer months aren’t just uncomfortable—they can be hard on their health and sometimes even fatal.
While people may think hurricanes or flooding would kill more people, extreme heat events are the biggest killer of any natural disaster, according to Dr. Laurence S. Kalkstein, an applied climatologist who studies the urban heat island effect in D.C. and other cities.
“We estimate that in the nation, in an average summer, 1,500 people die of the heat,” Kalkstein says.
With summertime temperatures rising and expected to soar as climate change takes hold, cities around the country, including D.C., are waking up to the need to protect residents, particularly the most vulnerable.
“We’re going to triple the number of extreme heat days by the end of the century, more or less,” says James Dunbar, a climate analyst with D.C.’s Department of Energy and the Environment.
This summer to date, Mayor Muriel Bowser has declared several multiday heat emergencies whenever forecasts surpass 95 degrees. Once the emergency is declared, the city’s heat emergency plan is activated and the D.C. Department of Human Services and the D.C. Homeland Security and Emergency Management Agency whir into action, putting neighborhood libraries and other community gathering spots into double-duty as cooling centers. These spaces are at the center of the city’s adaptive measures when it comes to extreme heat. D.C. and other cities are also exploring ways to reduce the number of annual heat emergencies that could mean the difference between life and death for people like Jackson, whose diabetes puts him at higher risk of heatstroke or other heat-related illness.
“Universally, heat is becoming a growing issue. That’s true internationally, nationally, but also at the local government level,” says Jennifer Li, a staff attorney and adjunct professor at the Georgetown University Law Center’s Harrison Institute for Public Law, who focuses on climate change adaptation from a community equity perspective. “We know that there is a strong correlation between historically redlined neighborhoods and heat.”
The Urban Heat Island Effect
While heat is something that affects an entire city, not all of its residents experience it in the same way. As the sun beats down on Columbia Heights, Jackson and the other street vendors are particularly exposed.
“[C]oming out here at 9 o’clock in the morning, I’m totally sweating pushing that cart, that’s how hot it is out,” says Jackson, who brings these wares on a handcart from his apartment on 16th Street NW. It’s a short walk, but even standing still on a summer day in D.C. can be oppressive.
For street vendors, as well as construction workers, landscapers, mail carriers, delivery drivers, child-care workers, day laborers, and others who work outdoors, the summer months can be hazardous. Infants and toddlers are vulnerable to heat-related illnesses because of their inability to recognize symptoms. The elderly are at high risk in summertime heat. Excessive heat can also complicate pregnancies. For obese people, the heat retained in the body can also lead to rapid and dangerous overheating during the summer, while people with chronic medical conditions are also at heightened risk of illness or death.
The shopping plaza in Columbia Heights is dominated by large buildings and wide roads and sidewalks. The concrete and asphalt absorb heat, causing the surface and ambient temperatures to rise. It’s a phenomenon known as the urban heat island effect, which dates back to the 19th century. British amateur meteorologist Luke Howard put thermometers in downtown London and the surrounding countryside. As he observed the temperature throughout the year, he noticed that temperatures were higher in the urban area versus the rural area.
More than 200 years after Howard made those temperature readings, researchers are using satellite imagery, online mapping, and data analysis to revolutionize our understanding of the urban heat island effect, how heat islands emerge, and how to reduce the heat and its effect on the humans experiencing it.
In just the past few years, this new research has provided new insights into environmental justice, offering what Jeremy Hoffman calls “a socially useful data set to talk about inequity through the lens of a climate stressor.”
Heat island studies not only boldly expose how urban heat disproportionately hurts poor and vulnerable residents, they pinpoint the problem at a remarkably granular scale; point the way to solutions; and provide residents and activists with crucial information for fighting for more equitable public policy and opposing real estate developments that would contribute to the warming trends.
In 2016, Hoffman read a newspaper article about the work of Vivek Shandas, director of the Sustaining Urban Places Research Lab at Portland State University, while Hoffman was completing his Ph.D. at Oregon State University. That year Shandas had led a heat island campaign in Springfield and Eugene, Oregon, and the previous year he completed one in Portland.
Hoffman, today the David and Jane Cohn Scientist at the Science Museum of Virginia, went on to study heat islands in Richmond in 2017. Shandas served as an adviser and his team created the study’s first maps. The project also led to story maps linking heat islands to housing discrimination there. He collaborated with the Richmond organization Groundwork RVA to come up with a climate resiliency plan.
The following year, the National Oceanic and Atmospheric Administration funded a summer campaign in Baltimore and D.C. Civilian scientists set up temperature sensors on their cars and drove around both cities, recording temperatures one August day. Thanks to that data, Hoffman and Shandas were able to create maps indicating the warmest and coolest parts of both cities in the summertime.
These campaigns were not only revolutionary because of how the data was gathered, they also involved the residents of the same cities.
“This was the first kind of community science based approach,” Hoffman says. By involving the community, he believes that the residents affected by extreme heat can learn more about the weather events affecting their cities and help create solutions.
The data gathered during these two campaigns is publicly accessible and has informed heat island projects such as the Code Red series, the University of Maryland’s Howard Center for Investigative Journalism’s award-winning project on heat and inequality in Baltimore, which inspired Hola Cultura’s heat island reporting this summer.
Using Hoffman’s 2018 heat islands data set, the Hola Cultura team created a map of D.C.’s heat islands, revealing where the District has its worst problems with urban heat.
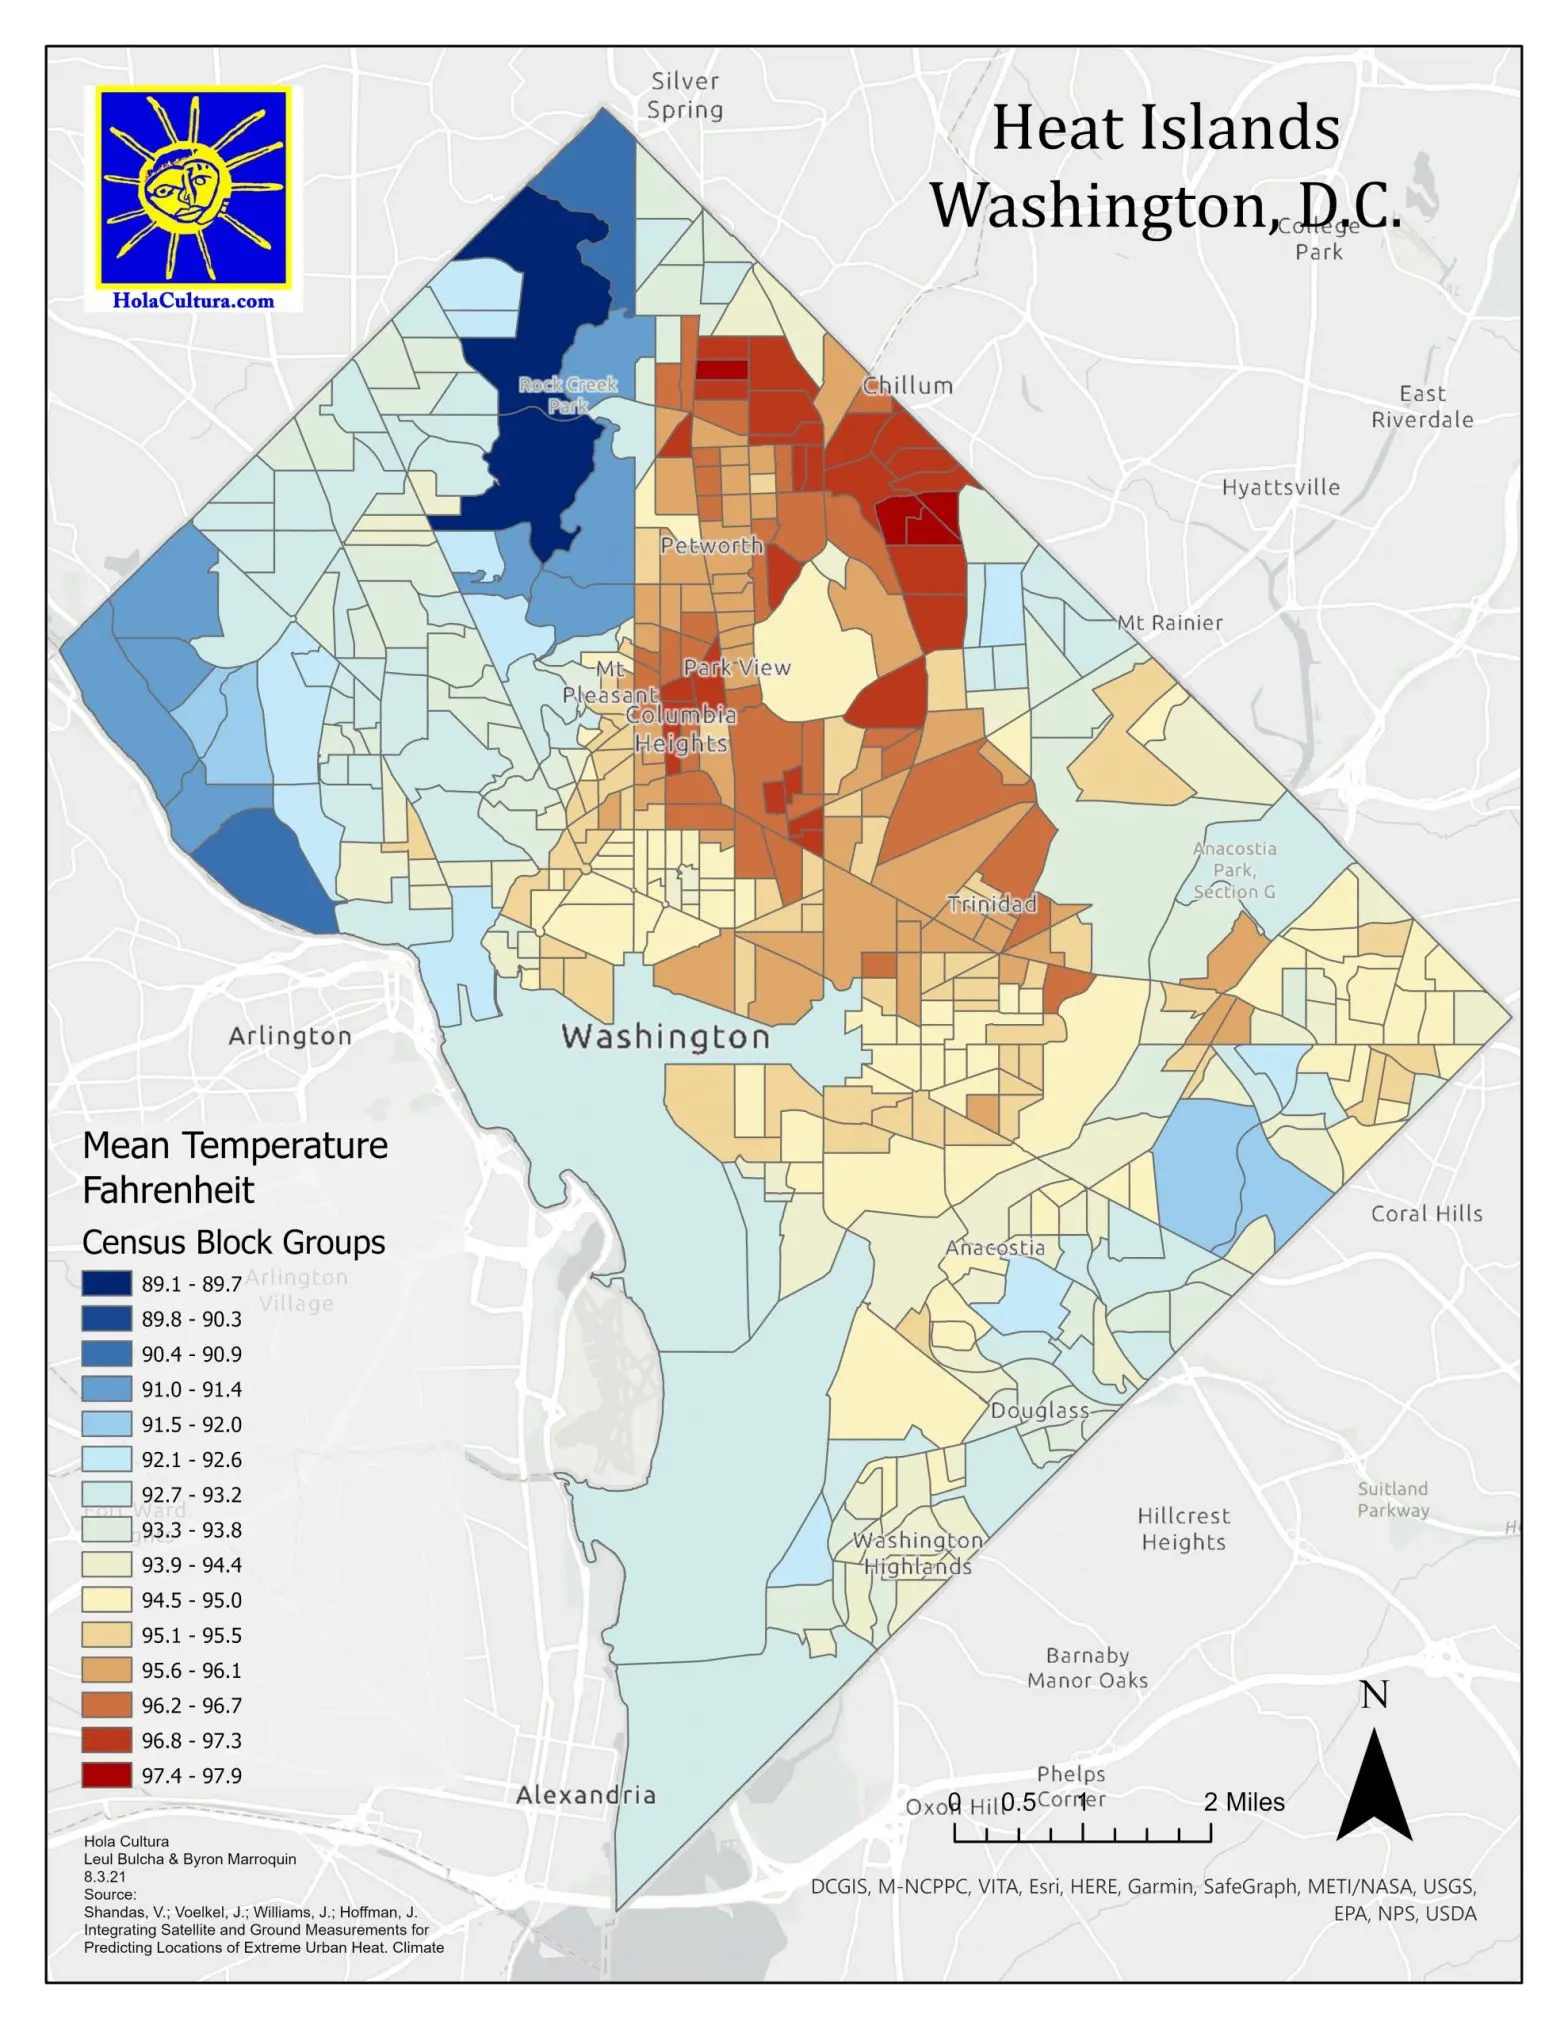
Using ANC Single Member Districts as a means of zooming in more tightly on the District’s problem areas, the team found that sections of wards 1, 4 and 5 have the most heat islands. The single hottest district recorded was an afternoon reading in SMD 1A10 in Park View and Pleasant Plains, but when mapping the mean of the morning and afternoon readings, an even clearer picture emerges.
When taking the mean of the morning and afternoon temperatures those citizen mappers collected, the hottest SMD in the city is 5A08 in Ward 5 near the Fort Totten Metro station, followed by 4B06 in Ward 4’s Park Manor, and 1A11 in Ward 1, around the Columbia Heights Metro Station, across the street from where Jackson sells his hats. Of the top 20 heat island districts, 8 are in Ward 4, 7 are in Ward 5, and 5 more are in Ward 1. In fact, all of the top 32 hottest districts (out of 296) were located in wards 4, 5, and 1.
Temperature readings for wards 7 and 8 were among the cooler in the city, apparently thanks to the lusher tree cover and more single-family, stand-alone housing, but high temperatures alone do not determine a person’s “heat vulnerability.”
Less surprising than the relatively cool temperatures east of the river is that 12 of the top 20 coolest districts are in bucolic Ward 3 in Upper Northwest, though the afternoon temperature reading in SMD 3F05, along a commercial stretch of Connecticut Avenue NW near Politics & Prose bookstore, registered the fifth hottest afternoon reading, illustrating just how much heat islands are localized phenomena linked closely to the trees overhead and the heat-absorbing asphalt and concrete underfoot and emanating from the surrounding buildings.
Upper Northwest neighborhoods, by and large, continue to benefit today from development decisions that date back to their earliest days. For instance, when Chevy Chase D.C. was first developed on former farmland more than a century ago, it was envisioned, according to the Chevy Chase Historical Society, as a “modern planned community” … “ a new kind of neighborhood” that left behind the District’s overcrowded, chaotic streets, and the urban heat, while taking advantage of a revolutionary technology of those times: the streetcar that carried the well-heeled to jobs in the city’s center.
In Upper Northwest neighborhoods, where the original developers are not only remembered for the “four squares,” Dutch colonials, and bungalows that largely still exist there today, planners also took great care in laying out the tree-dappled thoroughfares and picturesque green spaces, historic planning decisions that continue to help keep those neighborhoods cool a century later.
Advances in online mapping like the ones Hoffman and his colleagues have developed show with increasing clarity and granular detail how differently historically White neighborhoods were developed even as much as a century ago, and how those decisions keep those neighborhoods cool today, compared with neighborhoods of color in the very same cities, where heat islands are a legacy of racism and discriminatory housing policies.
Online mapping has made it possible to assess present conditions, plan for a better future, and expose direct links between today’s urban heat and past decisions by public officials, private developers, bankers, and individual homeowners—even redlining.
Homeownership is inextricably connected to wealth and acquiring wealth through generations. A family that owns its home is more likely to have financial stability, send the kids to college, and climb socioeconomic ladders. But in the District and nationwide, people of color are less likely to own their own homes than White people. That trend has long historical roots and many chapters. One of the more infamous is “redlining,” a discriminatory housing policy established by the Home Owners’ Loan Corporation in the 1930s and practiced by the Federal Housing Administration in such a manner that it limited access to homeownership and wealth creation among minorities and contributed to a range of social disparities. HOLC’s so-called “security maps” literally drew red lines through neighborhoods where residents of color lived, labeling them risky investments, which made it harder for aspiring homeowners to get mortgages and meant far less government and private investment.
“[G]overnment regulations and recommendations at every level of government sought to keep Black and white residents separated, subsidizing construction, loans, and housing for white residents while preventing Black residents from building wealth through homeownership,” wrote the historical research firm Prologue DC, citing the book The Color of Law: A Forgotten History of How Our Government Segregated America, by Richard Rothstein, in a 2018 article published by the D.C. Policy Center.
Historians have documented redlining’s disturbing and continuing legacy in cities around the country, including D.C., where racial and social disparities in wealth, income, and homeownership are all too apparent, according to the D.C. Policy Center and other sources. Redlining’s legacy has also, quite literally, been etched on District cityscapes.
The District’s long history of discriminatory public and private practices cemented patterns of segregation and underinvestment in neighborhoods of color, particularly Black communities. The U.S. Supreme Court eventually struck down racially restrictive covenants as unenforceable in 1948. The passage of the Fair Housing Act of 1968 went even further as a national repudiation of the country’s racist housing practices, but neighborhoods that are predominantly home to people of color continued to suffer from the consequences of longtime neglect and underinvestment.
“What we’re seeing now is the outcome of decades of housing discrimination,” says Li, the Georgetown attorney. Three groundbreaking scientific papers published in the past two years also reached that conclusion.
Hoffman and Shandas participated in a groundbreaking 2020 study, for instance, that drew a direct correlation between the locations where redlining occurred in 108 U.S. urban areas and the amount of green space in those cities today.
Another paper published in the journal Environmental Health Perspectives in January 2021 looked at 102 U.S. metropolitan areas to assess whether their “historical HOLC investment grade” correlates with the amount of green space in those places as of 2010. The authors concluded that “our findings align with those previous studies and suggest that the HOLC’s Security Maps affect current-day green space with decreased greenery in neighborhoods with worse HOLC grades.”
A third scientific paper published in NPJ Urban Sustainability concluded: “Our analysis of 37 metropolitan areas here shows that areas formerly graded D, which were mostly inhabited by racial and ethnic minorities, have on average ~23% tree canopy cover today. Areas formerly graded A, characterized by U.S.-born white populations living in newer housing stock, had nearly twice as much tree canopy (~43%). Results are consistent across small and large metropolitan regions.”
Researchers have noted that redlined communities are also more likely to have multilane highways, railways, and industrial enterprises with a lot of heat-absorbing surfaces. Public housing projects, meanwhile, are seldom laid out like Upper Northwest’s “garden communities”; they are much more likely to have dense footprints made of a lot of heat-absorbing concrete and asphalt.
There is no existing redlining map for the District of Columbia. “It is not clear if HOLC chose not to survey Washington or if the survey results and maps simply were not preserved,” Amy Hillier, a planning scholar, wrote in a 2005 paper. However, the city’s long history of housing segregation has still been well documented. It runs the gamut from forced displacements to racially restrictive covenants, racist banking policies, and denied mortgage loans.
In neighborhoods that experienced “White flight” during the civil rights era and soon attracted new working- and middle-class African American families, these historically racist practices have had real and lasting effects. Take ANC 1A10 covering Pleasant Plains and Park View, which had the single hottest afternoon temperature reading in the District. Until the 1990s when Hispanic families began moving in, the neighborhood was almost exclusively home to Black residents, recalls Darren Jones, president of the Pleasant Plains Civic Association.
Jones grew up in Pleasant Plains and eventually purchased a home there in the early 1990s, but only with great determination. He describes mortgage companies at that time as predatory institutions that charged higher interest rates or refused loans to people of color and neighborhoods deemed risky.
“When I bought this place in ’93, it took six months to get a mortgage,” he says, despite being gainfully employed at the Library of Congress and teaching part time at the University of the District of Columbia. He had more than sufficient income to make the monthly payments, but still struggled to get a mortgage.
Today, people of color continue to suffer the legacies of segregationist practices. In what is considered “modern-day redlining,” African Americans and Latinx people are routinely denied mortgage loans “at rates far higher than their white counterparts,” according to a 2018 article in Reveal News. Though redlining practices have been outlawed for more than 50 years, “patterns of discrimination by banks and mortgage lenders that has kept people of color from building wealth” persist today.
Banks are legally obligated by the Community Reinvestment Act to solicit clients from all communities, but critics say the Department of Justice has shown tepid interest in suing lenders for racial discrimination.
By the 2000s, many Black and Latinx Washingtonians were also facing displacement due to the rising cost of living, and higher property taxes driven by gentrification’s upward pressure on home values.
“The taxes have driven a few people out,” says Jones, whose own home now has an assessed value of $800,000.