Lesson Plan August 14, 2026
Using GIS to Track Lead Levels in Chicago
State:
Grades:

This lesson was created by Catherine Yackee, a high school Social Science educator in Chicago, IL, as part of the spring 2025 Pulitzer Center Teacher Fellowship program. It is designed for facilitation across approximately three class periods.
For more lessons created by Pulitzer Center Teacher Fellows in this cohort, click here.
I wanted to pick a topic that has real-world implications for my students... The students began to question why this lead issue is not resolved and discussed what the government should do to resolve this issue.
Lesson Overview
This lesson looks at lead exposure in Chicago. Students will begin by reading articles about the lead issue in Oakland, California. Then, students will review materials about lead exposure in the Chicago area and use lead testing strips to test water in different regions of the neighborhood.
The goal of this lesson is to connect themes covered in human geography. Students have studied concepts in urbanization, such as brownfields and industrial pollution. They have also studied inequalities in regions of the Chicago area. They will be able to make connections to these topics by engaging in this project.
Essential Question
How widespread are high levels of lead on the South Side of Chicago?
Performance Task
- Instructs students to conduct lead level tests on water around the Chicago area using drinking water testing kits.
Educator note: My students used these water test kits. Take time to review the directions in advance and walk through them with students.
- Have students add their testing results to a class story map.
- Blue pins on map-safe levels
- Purple pins on map-lead levels of at least .20/mg
Assessment
Each student should add their data points to the class story map. You may make requirements on how many data points are collected. The assessment is a completed/not completed grade.
Notes on Context & Content Advisory
This lesson examines the effects of lead poisoning on children. Many of our students may live in environments where they may have seen these effects firsthand.
Three-day lesson plan, including a warm-up question, text and video resources, discussion questions, and a final activity. Download below to read the complete lesson plan.
Lesson Resources
AP Human Geography College Board Standards
Topic 6.11
Challenges of Urban Sustainability
SPS-6.B.1 Challenges to urban sustainability include suburban sprawl, sanitation, climate change, air and water quality, the large ecological footprint of cities, and energy use.
In this lesson, students studied Pulitzer Center journalism to learn about the consequences of lead in drinking water and read local journalism to examine politicians' response to lead pollution in their region. To develop their opinions on the subject, students completed a gallery walk, commenting on various facts about lead contamination.
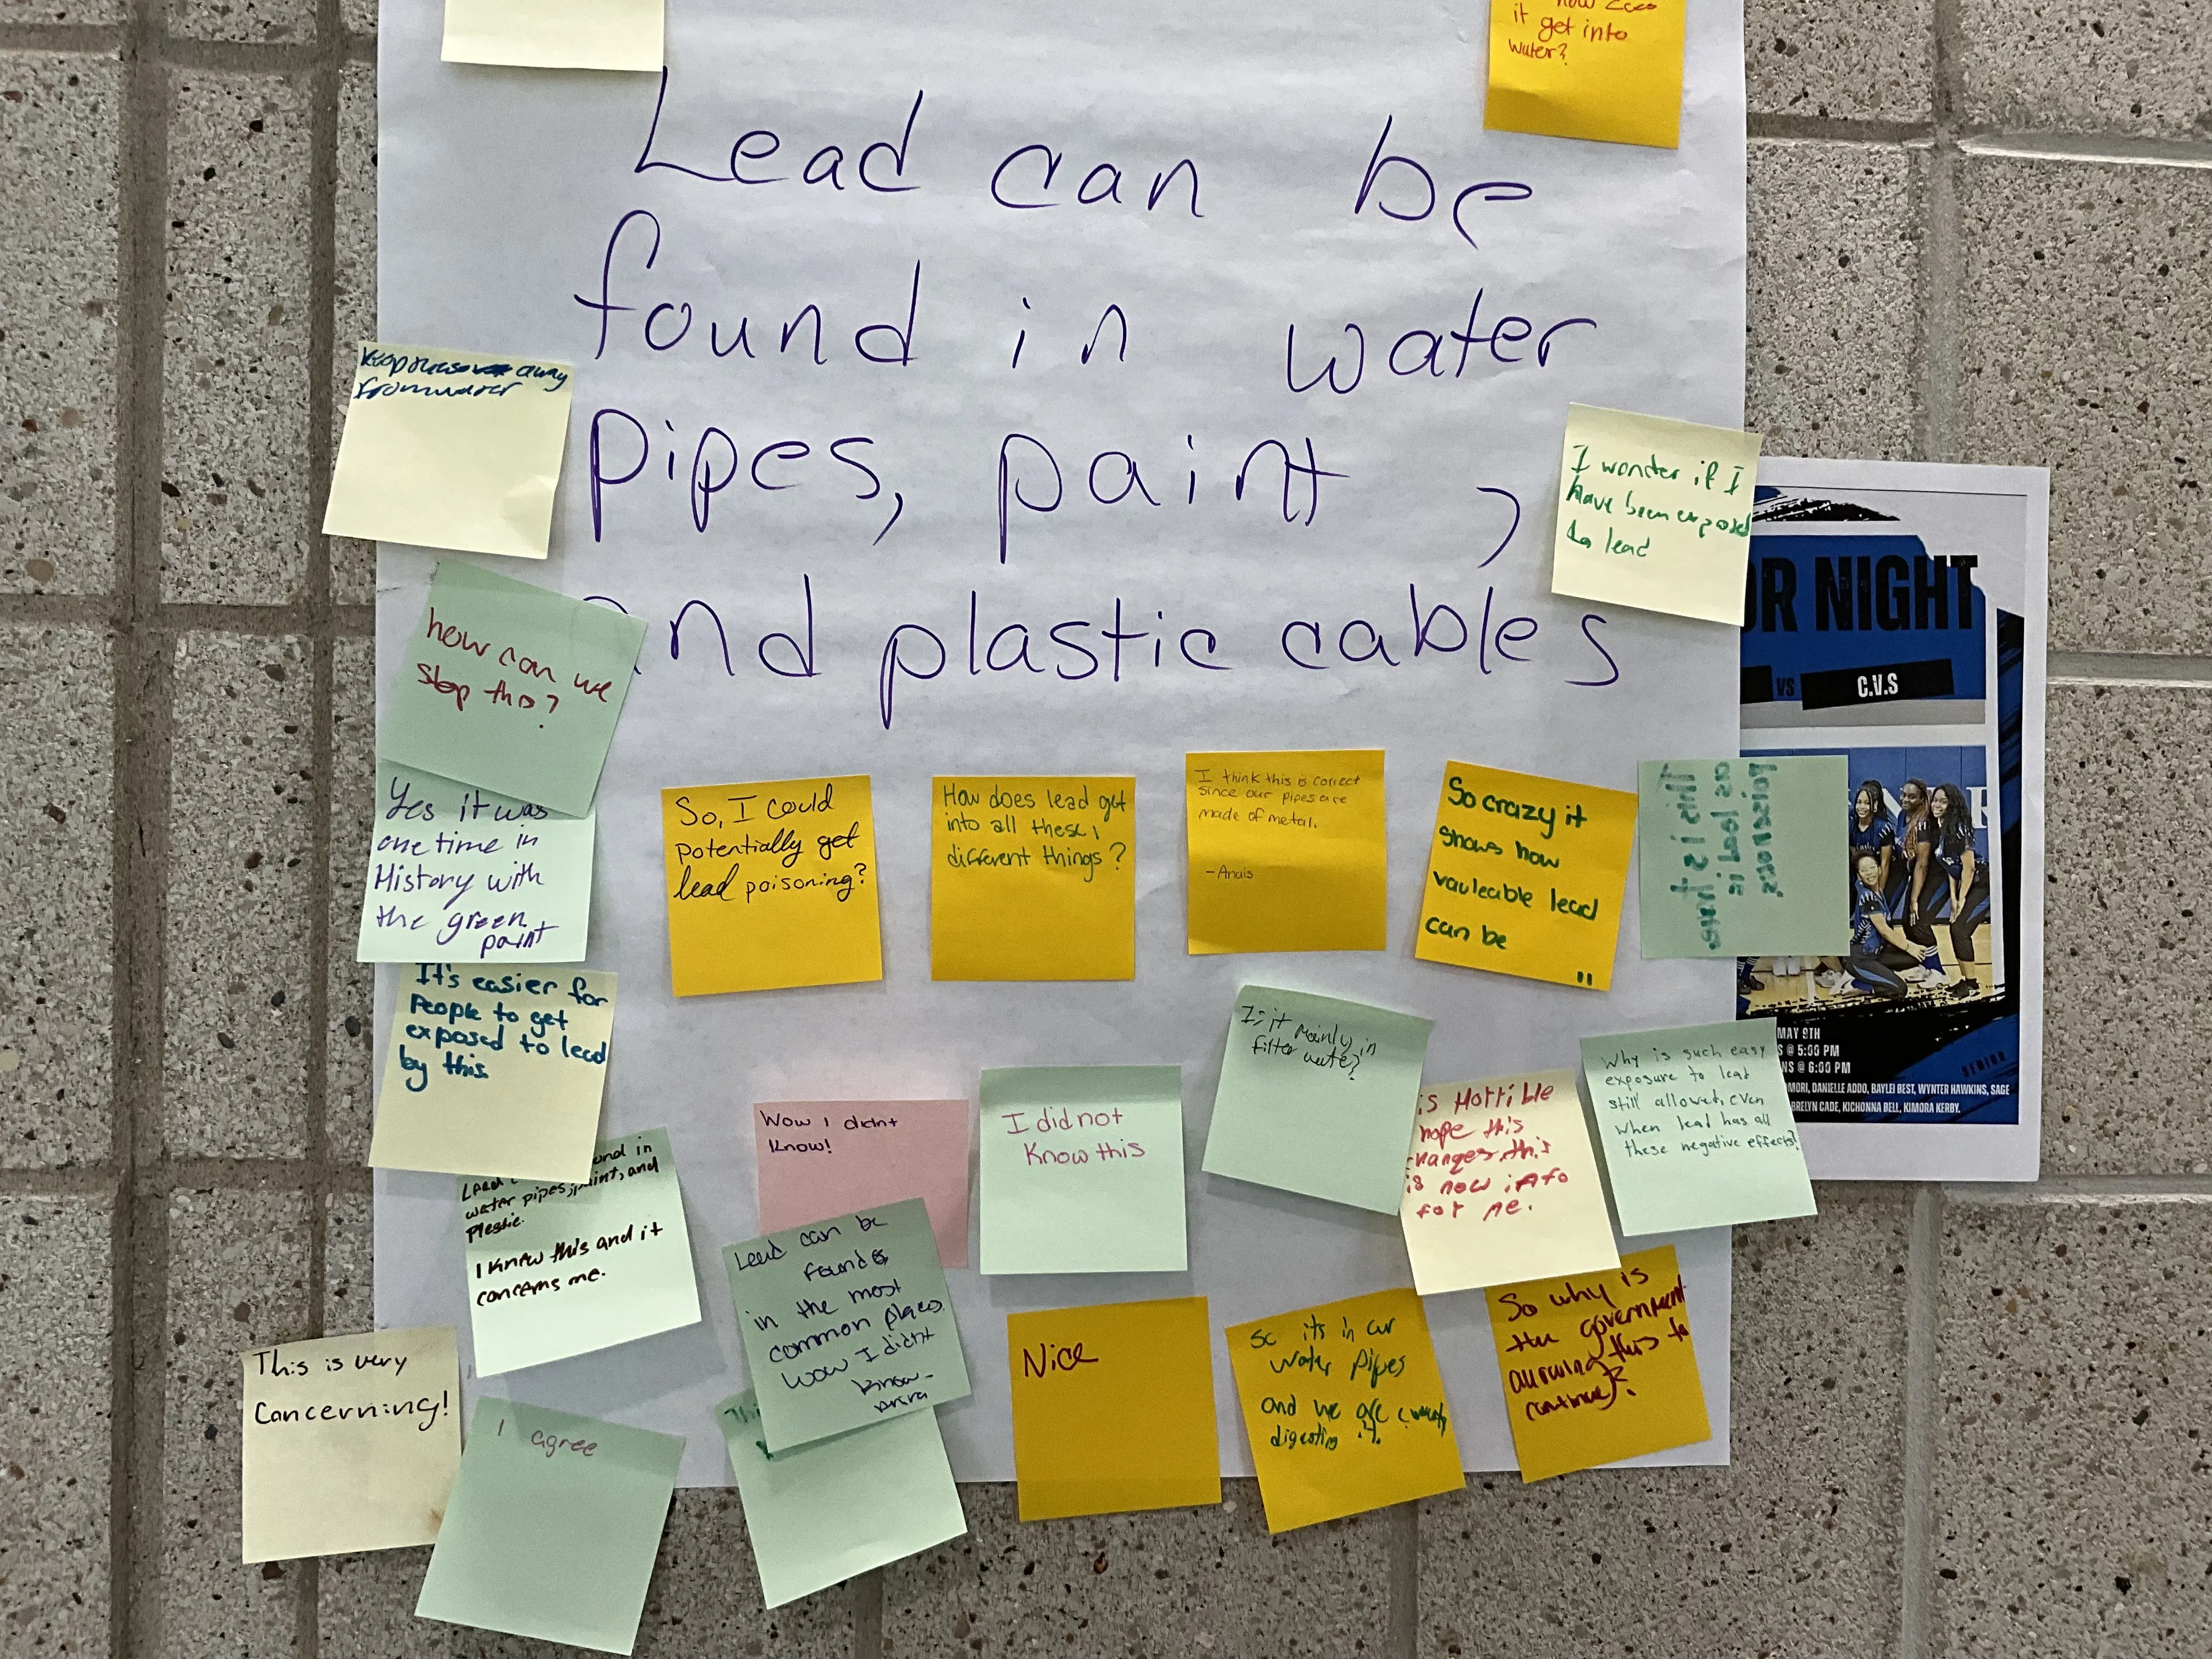
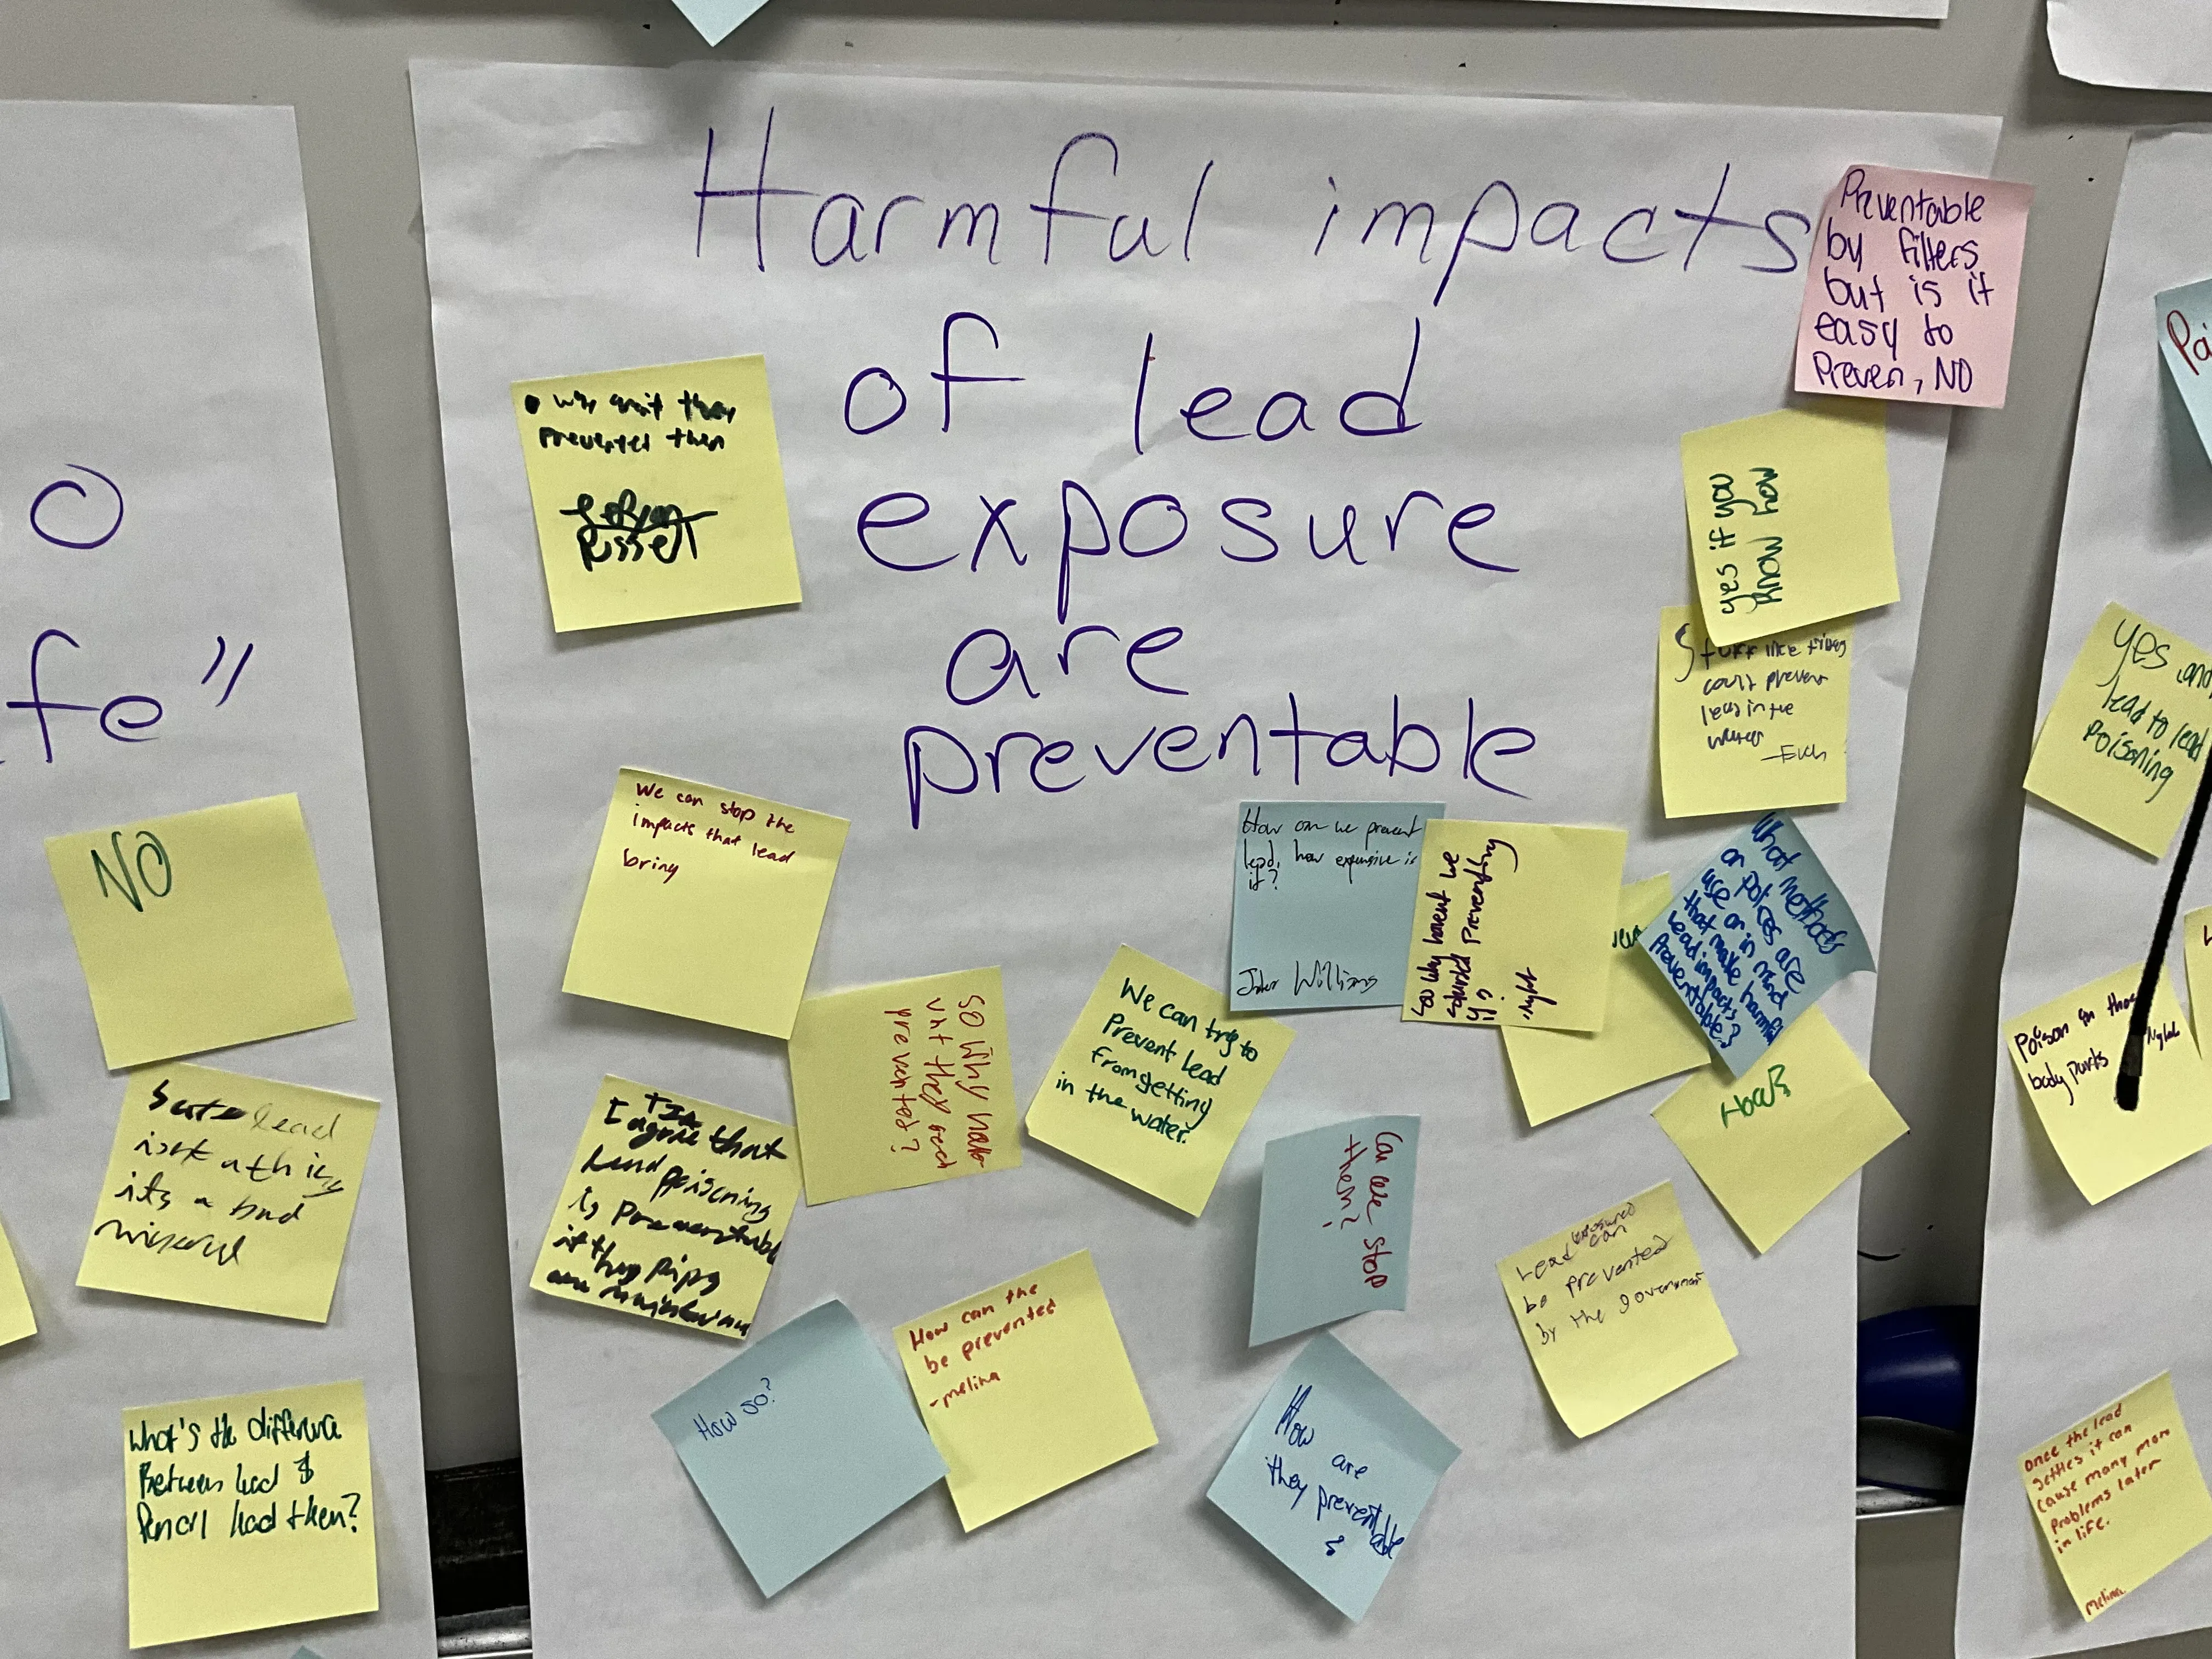
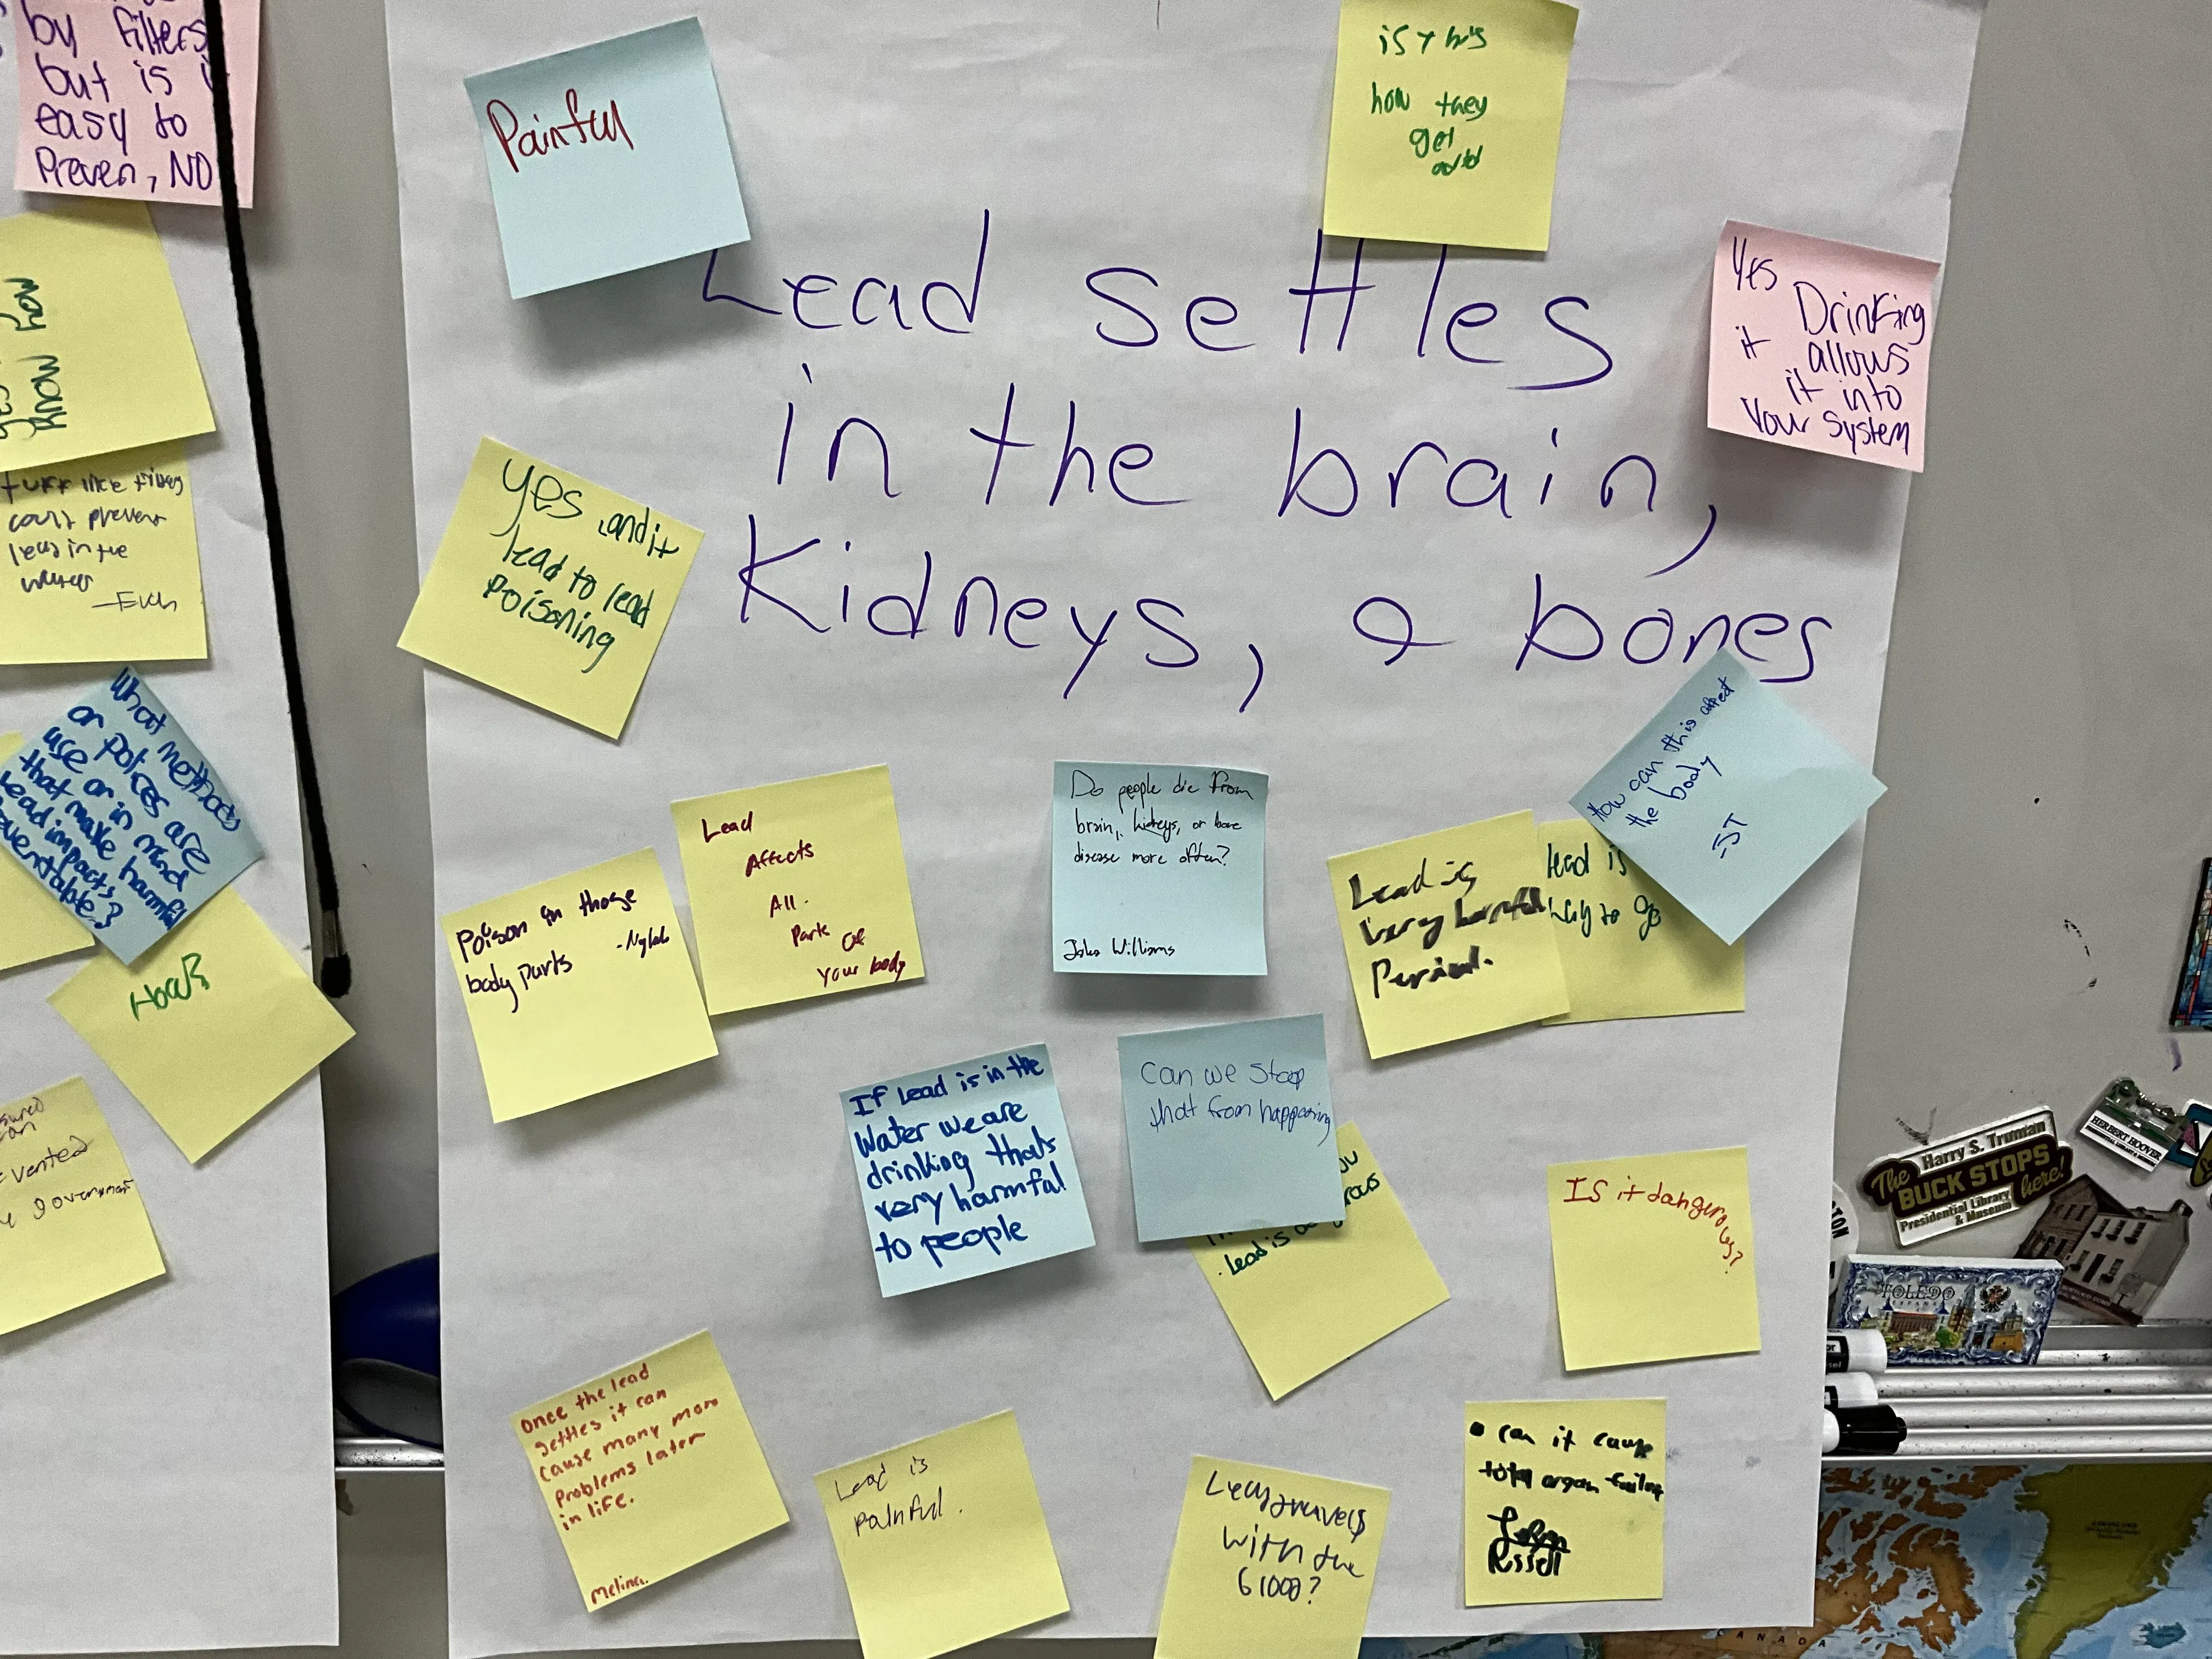
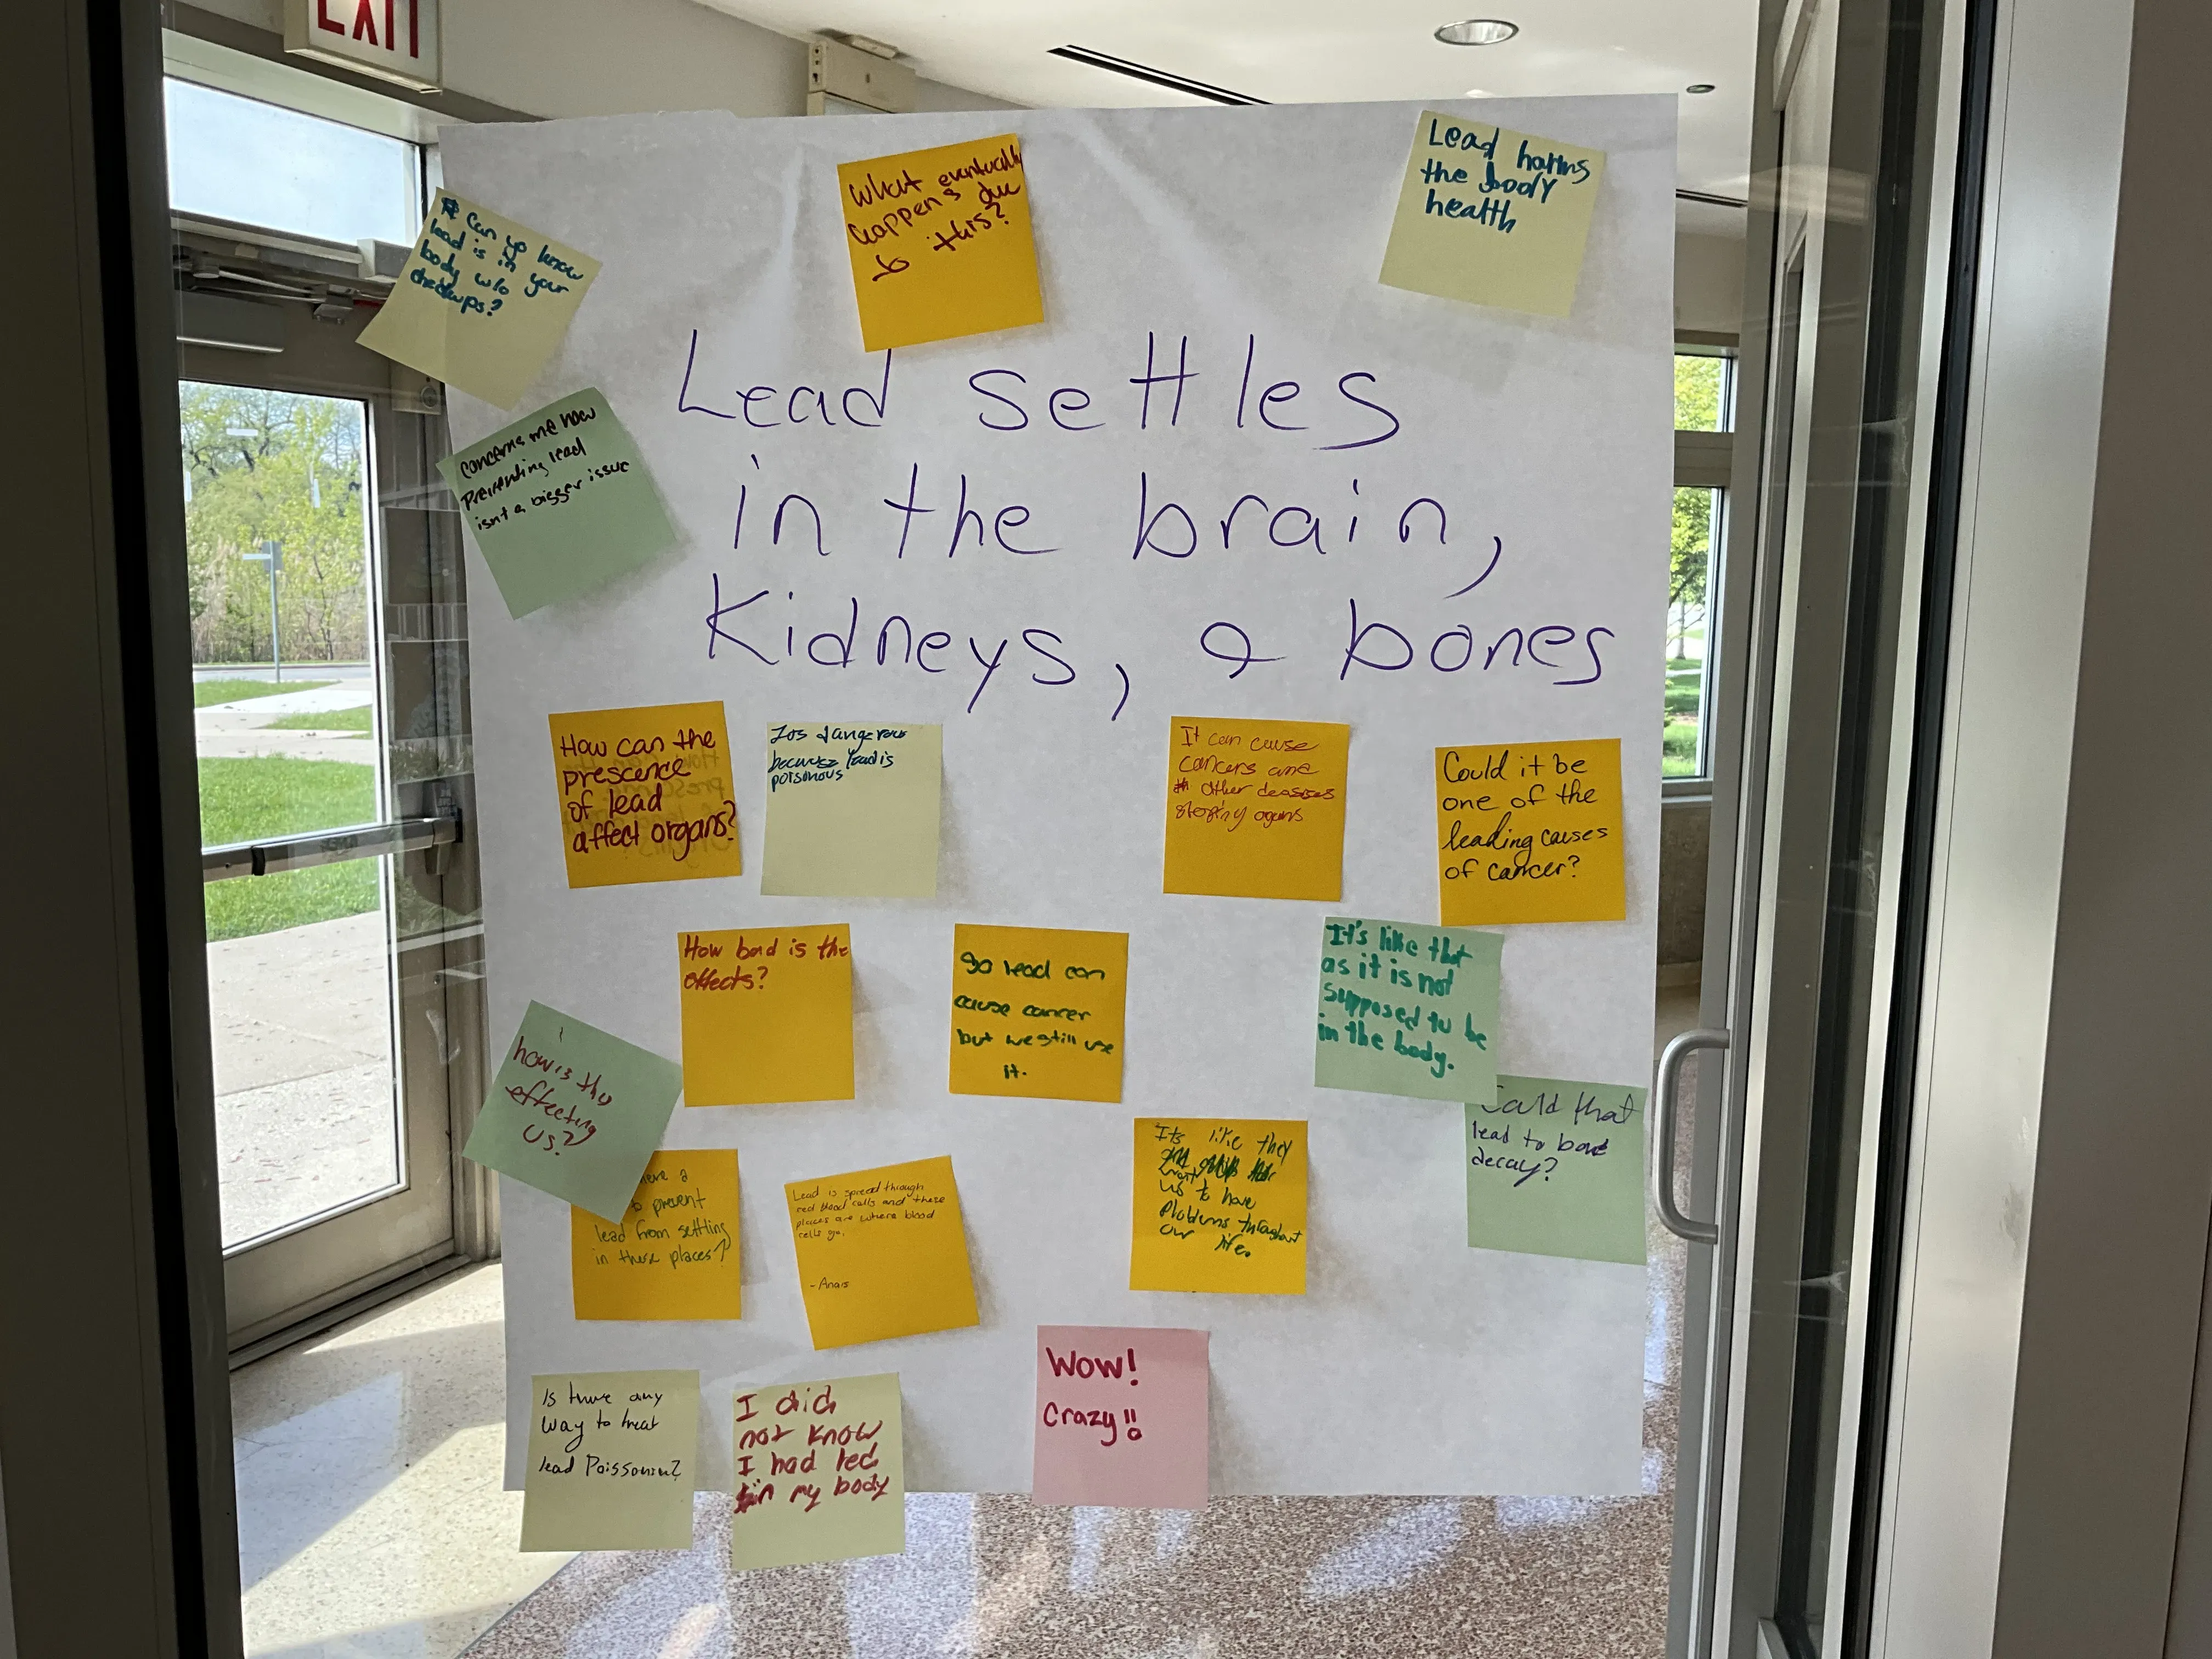
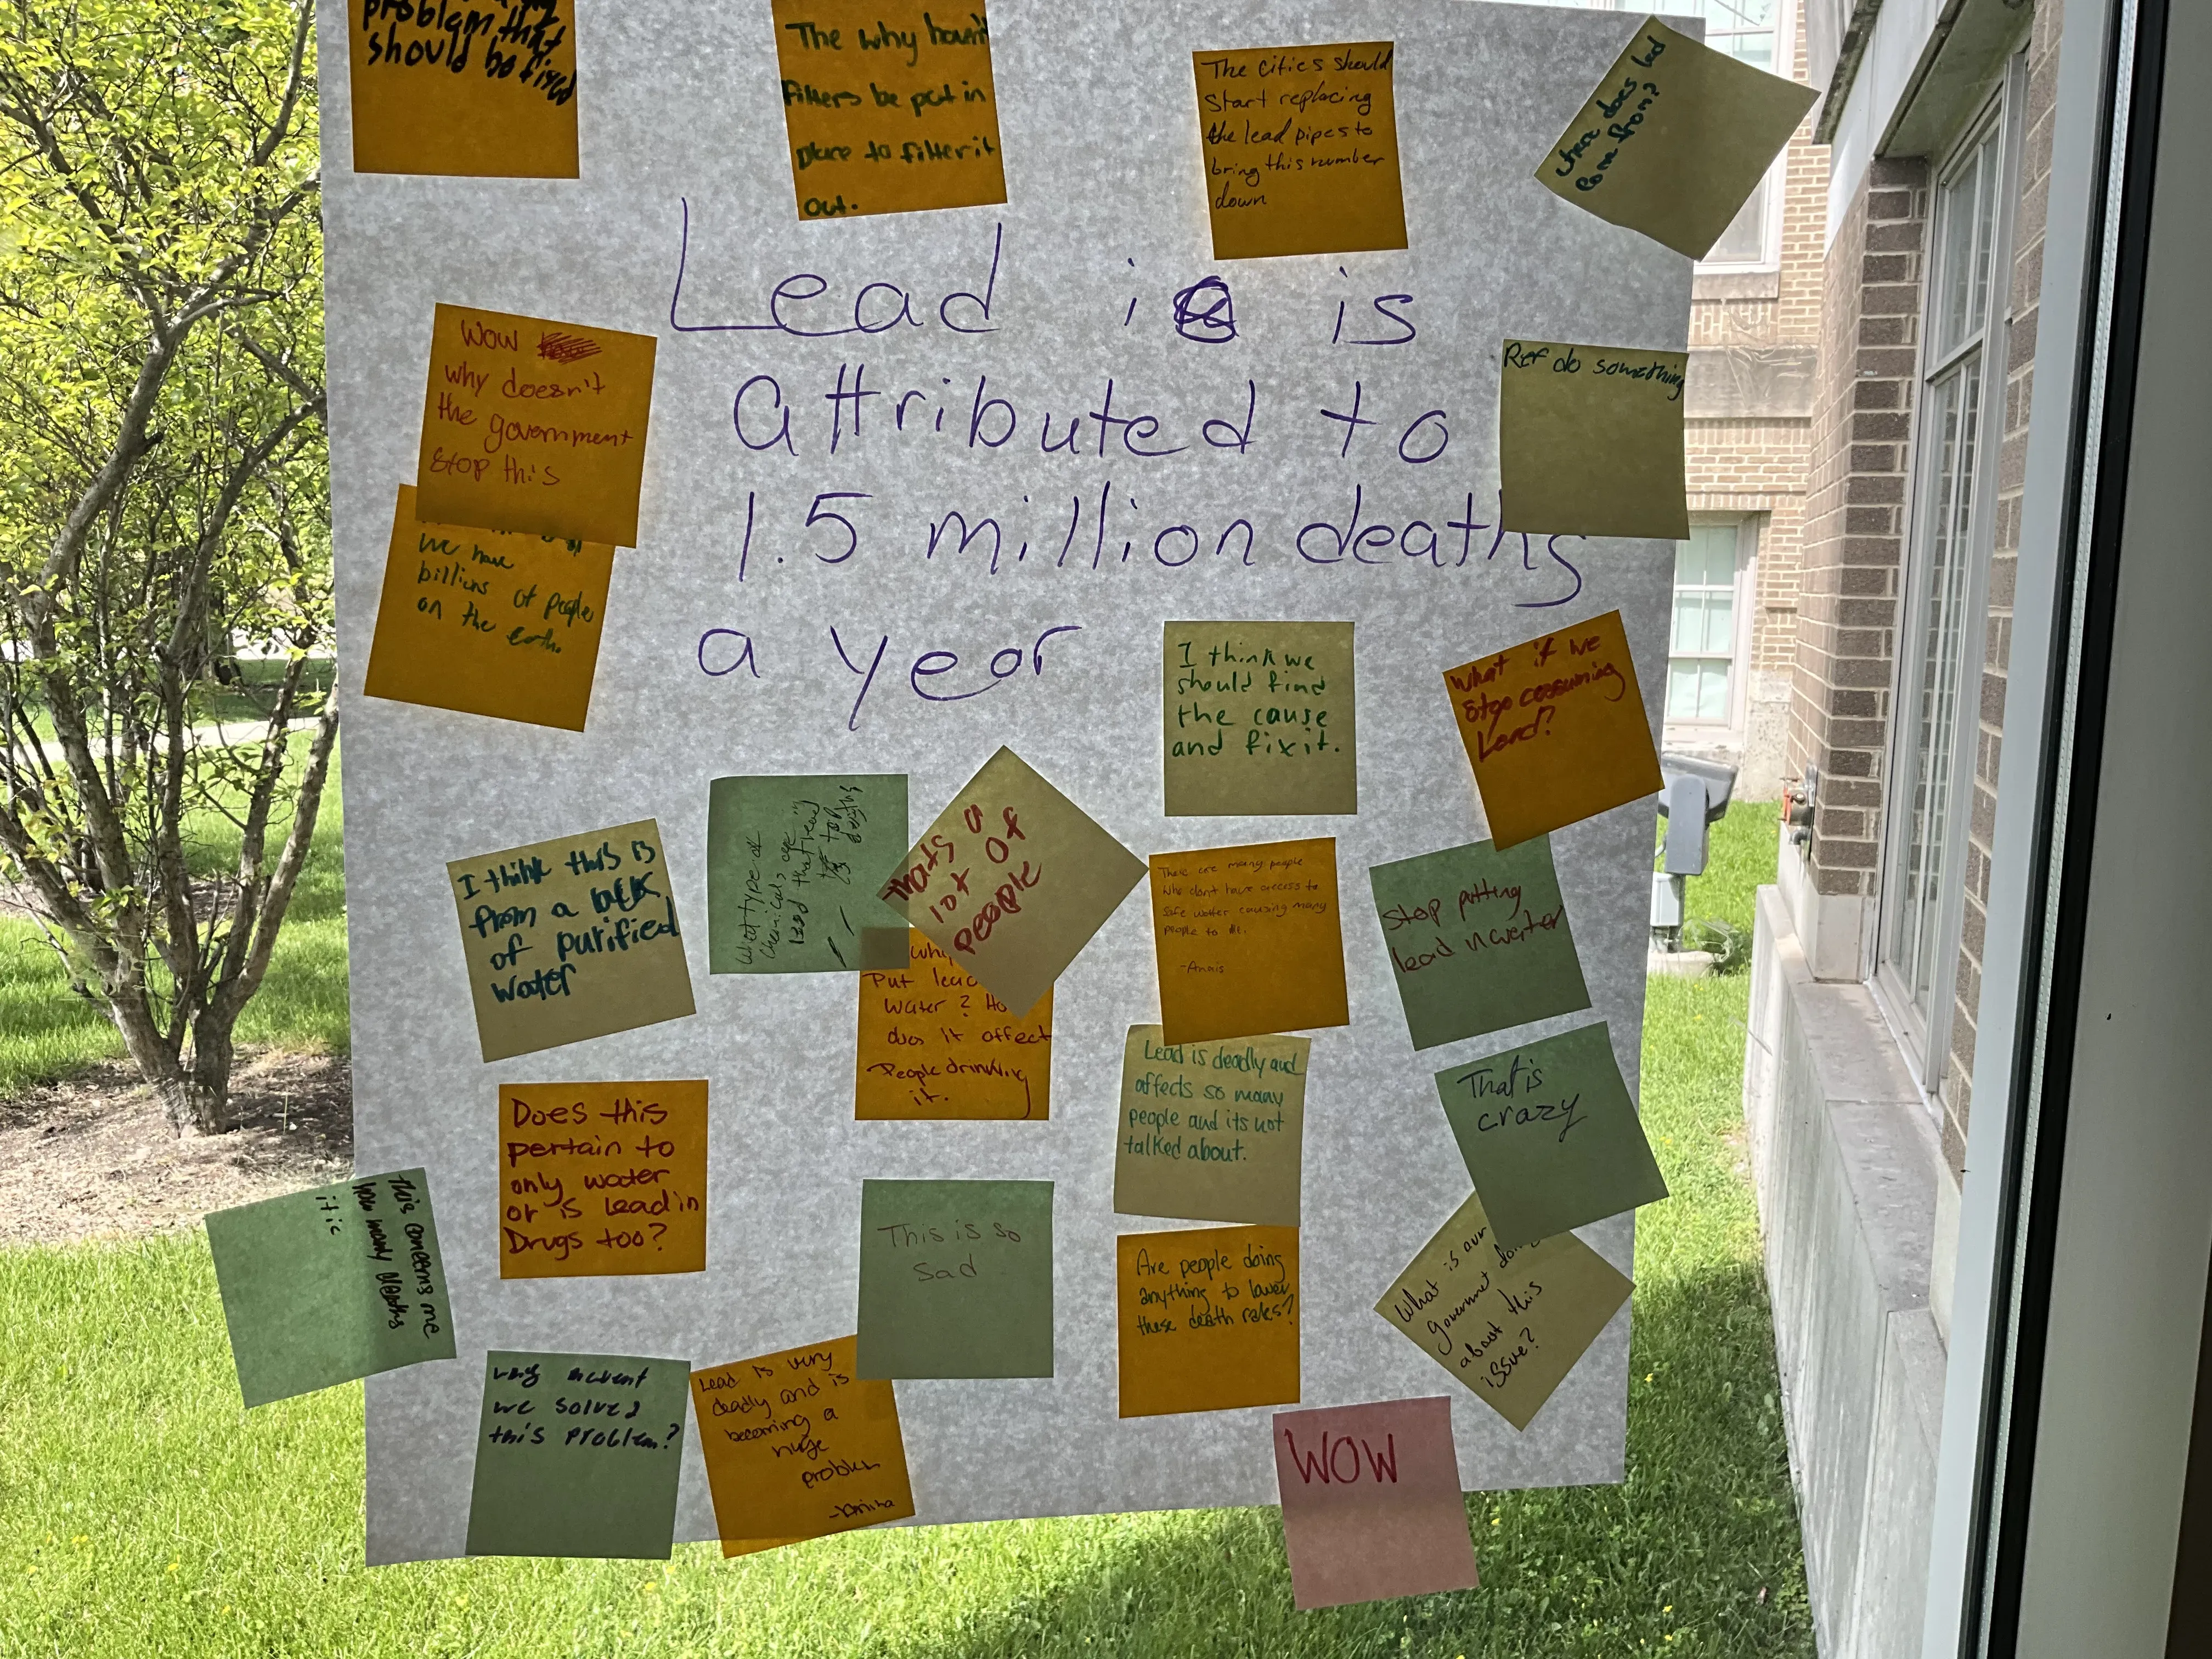
After analyzing these facts, students tested the water in their community and discussed solutions to the lead local problem.
Teacher Reflection
Catherine Yackee is a high school Social Science educator at Brooks College Prep in Chicago, IL. Yackee created the lesson plan, Using GIS to Track Lead Levels in Chicago as a part of the spring 2025 Teacher Fellowship for alumni, “Global Issues, Local Contexts: News for Civic Knowledge and Engagement.” Her lesson reached 75 students. At the conclusion of the fellowship, Yackee shared the following reflections on her experience developing and teaching the lesson.
What is the focus of your lesson plan, and why did you write this lesson for your community?
The focus of the research is on lead exposure. I became curious about the Chicago lead situation after reading the articles about Oakland. Chicago was an Industrial Revolution city. Even though most of the industry has long since departed, the pollution remains. This issue is particularly important for the area around the school because the South Side of Chicago was a hub for this industrialization. Over the past few years, there have been efforts to clean up the heavy metals left behind. This issue is near to my heart because I know many people who have died from various cancers that could only have been caused by environmental factors.
I decided to explore the issue of lead because I was aware that Chicago has many neighborhoods whose water pipes are vastly out of date. Lead is one of the leading causes of childhood developmental disorders. I discovered that Chicago’s situation is very similar to the situation in Oakland. Chicago has so many lead pipes that the EPA has given the city up to 40 years to remediate the problem.
What did your students learn while engaging with this lesson?
After engaging with the reporting, my students compared accounts of lead poisoning in Oakland, CA, to media coverage of Chicago’s issues with lead. They conducted water tests and used data to develop a lead count map for the city. Students were shocked that the lead pipe issue had not been remediated completely. Some of their comments included:
- “If the government knows about it, why won’t they take care of it?”
- “Our water is just as bad as Flint’s.”
- “I bet there are still lead pipes in our areas.”
Students were extremely invested in getting water samples from their homes and seeing the results. Many of the students said they did not drink tap water because they already had misgivings about it. They also felt the same way about the water at school, even though it is filtered. Students tested all of the fountains at school and were surprised to find that all the fountains tested clear of lead. I explained to them that school pipes were probably some of the first pipes replaced due to the effects of the lead exposure on developing brains.
What did you learn by creating and teaching this lesson?
The study of environmental pollution is near and dear to my heart. The area surrounding our school was a heavy industrial area and is still polluted many years later. If you live in a city like Chicago, the remnants of the Industrial Age are still around. I wanted to pick a topic that has real-world implications for my students. Many of them have lived in substandard housing and seen medical impacts of environmental pollution. The students began to question why this lead issue is not resolved and discussed what the government should do to resolve this issue.
There may be toxins left behind that have caused illness and/or death to the people still living in particular areas. If lead is not the primary toxin, there may be others. I would encourage looking into the industrial solvent exposure in your area and investigating the harm that may be caused by the pollutant.
About Catherine Yackee
Catherine Yackee has been a Social Science educator in the Chicago Public Schools for the last 18 years. In her capacity as an educator in Chicago, she has served as a department chair, grade level team leader, and course leader. She has written curriculum for various institutions such as the Studs Terkel Archive and the Archibald Motley project with Columbia College in Chicago.